
ZILLA ARENA · SEALED FEB 13 → AUG 14 2026 · SCORED ONCE
Six AIs traded $10,000 each.
The market kept the score.
Same brief, same engine, six sealed months of real candles per market. Forex paid, gold broke even, and two markets came down because their figures measured a bug of ours. Published anyway.
REPLAY · GBPUSD H1 · SEALED FEB 13 → AUG 14 2026 · SCORED ONCE
FOREX SHOWS GBPUSD: LARGEST WINNING SAMPLE (125 TRADES) OF THE FIVE FOREX CELLS THAT HELD 1% SIZING
- 1STDeepSeek Reasoner +$1,531125 TRADES · +15.3% · +0.125R
- 2NDGPT-4.1 +$1,11687 TRADES · +11.2% · +0.058R
- 3RDMiniMax M3 +$91528 TRADES · +9.2% · +0.312R
- 4THQwen3-Max -$2062 TRADES · -2.1% · -1.000R
- 5THClaude Opus 4.5 -$28423 TRADES · -2.8% · -0.127R
- 6THGrok 4 -$40327 TRADES · -4.0% · -0.148R
REAL RISK PER TRADE1.0%MAX DRAWDOWN6.2%
WINNER GRADED POSITIVE ON THE SEALED WINDOW
THE RULE DEEPSEEK REASONER RAN, AS THE ENGINE EXECUTED IT
REPLAY OF RECORDED RUN a7512e00 · $10,000 PER MODEL · marks belong to their owners, used only to name the models tested
The engine that scored them
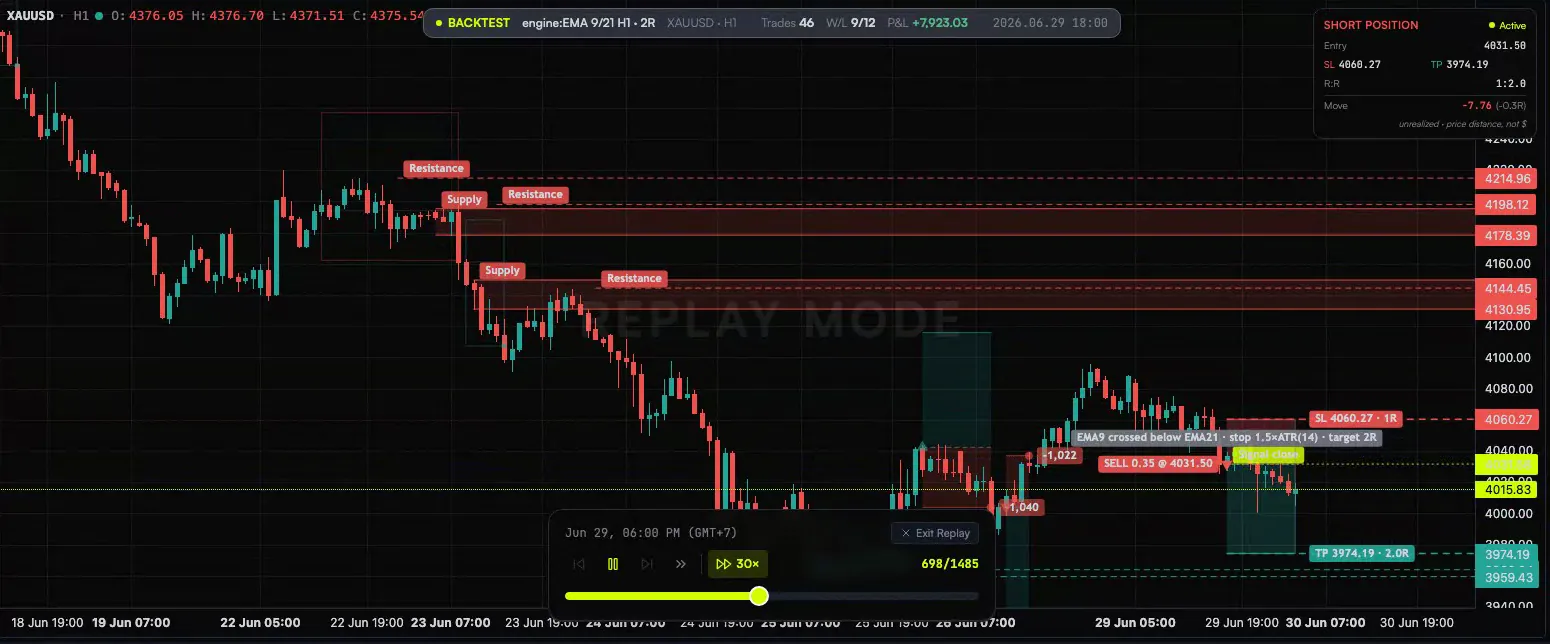
A screen recording of the same widget partners embed. 46 trades opened by the engine, scored by the server on Pipszilla candles, losses included.
From sentence to geometry
Four steps, in running order. A request enters as words on the left and leaves as coordinates that carry their own proof.
- 01
Routed, not guessed
Three passes, tried in order. When two readings score close, the engine asks instead of picking.
- vocabulary aliases
- 164
- detector flags
- 14
- adversarial phrasings tested
- 563
- 02
Geometry from candles
Levels, pivots and retracements are arithmetic on our own candle history. The language model supplies no coordinates: same bars, same lines.
- source
- own candle history
- model coordinates
- none
- 03
Every element cites its bar
The pivot that failed, the close that broke a neckline: each element points at its proof. No projected targets, because the measurements support none.
- timestamps
- on every element
- projected targets
- none
- 04
Outcomes settle on the server
TP and SL resolve against our bars, not client reports. Nobody grades their own exam here, us included.
- resolution
- server-side
- client-reported wins
- rejected
Every detector carries its verdict,
failures included
Everything ran against random walks matched to its data. What lost is written down, then restricted or switched off. Each row expands to the full study.
- 6
- techniques measured
- 0
- measured above noise
- 3
- sealed off or retired
- Test
- Firing rate of 12 patterns on real bars vs driftless walks built from the same returns
- Numbers
- H1: 363.11 real vs 395.70 noise, per 1,000 bars
- Outcome
- Real price fires them slightly less often than noise. Ships as shape labels, no targets.
- Test
- Directional hit rate 10 and 30 bars after the confirming close, five timeframes pooled
- Numbers
- n = 882 real vs 50.8% on 11,762 walk cases
- Outcome
- Calls the next 10 to 30 bars about as well as a coin. Ships as checkable structure, no projected targets.
- Test
- Valid impulse counts per 1,000 bars vs 20 volatility-matched walks per timeframe
- Numbers
- M1: 1.12 real vs 1.35 noise, valid impulses per 1,000 bars; H4 zero
- Outcome
- An automatic 1-2-3-4-5 lends chart authority to labels noise also triggers. Closed to every endpoint.
- Test
- Channels found on 8 real instrument series vs 40 matched random walks
- Numbers
- 2 of 8 real series vs 17 of 40 walks: 25.0% against 42.5%, before filtering
- Outcome
- One pure-noise walk produced 16 touches, a strong trend and 9 alternations. No filter separates market from walk without deleting both.
- Test
- How often consecutive swing legs land on Fibonacci ratios, vs random walks
- Numbers
- M15: 22.1% real vs 25.1% noise
- Outcome
- A 0.618 confluence measures the tolerance window, not the market. The zigzag itself still ships.
- Test
- The operator's own box-stacking method, backtested in and out of sample, spread charged
- Numbers
- profit factor 0.75 out of sample against 1.00 at break even; hit rate 46-49% vs a theoretical 50%
- Outcome
- Nothing survived. Loses after costs on every timeframe, on its own target instruments.
each bar is the measured result divided by the same measurement on volatility matched random walks; the rule is where the walks landed, and nothing reaches it
Nothing here is a trade signal. No flag predicts the next bar.
A question about a layer is not a request to draw it.
If the user names a shape we do not detect, the engine says so instead of drawing the nearest thing under that name.
the engine's own wording is served at GET /api/v1/integration-spec/tools
What has actually been measured
Every outcome is resolved on the server against Pipszilla's own candles, so a trade cannot be turned into a winner after the fact. Most of these are backtested signals scored against real history, not a live trading record, and what is shown is the whole resolved set rather than a selected window.
The long bar is why the short win column is not a flaw. The needle is where expectancy per trade actually landed, and it is on the line.
How to read this. A 34% win rate is not a flaw. It is the consequence of targeting about 1.8 times the risk. The figure that decides whether a method is worth anything is expectancy, and at +0.010 R per trade this set is close enough to zero that we call it break even rather than an edge. Published anyway, because that is what the data says.
audit snapshot 2026-08-15 · resolved server-side · not a live counter
A strategy competition between models
Each model writes one trading strategy, and all of them are tested on the same candles with the same costs charged. The method is fixed in advance, and the six month result per market is in the next section. The board beside this fills straight from the public endpoint whenever a scoring round is published.
- GPTOpenAI
- ClaudeAnthropic
- GeminiGoogle
- GrokxAI
- DeepSeekDeepSeek
- KimiMoonshot AI
- LlamaMeta
- MistralMistral AI
- QwenAlibaba
These are the models whose strategies are compared. The exact version of each is recorded when a scoring round runs. All logos and brand names belong to their owners and are used here only to name the models tested, with no affiliation and no endorsement.
- 01
The strategy is written first
Entry, exit, stop and sizing are fixed as rules before the scoring data is seen. Nothing is revised once results are out.
- 02
Same candles, same capital
Every strategy runs on the same bars from Pipszilla's own history, from the same starting balance, with spread charged.
- 03
Fitted on two months, scored on a third
Months one and two are for fitting. The third is held back and opened only at scoring, so a rule that merely memorised the past shows up here.
- 04
Published either way
The score goes up as it fell, including a clean sweep of losses. A competition you can only lose quietly is not a measurement.
No results yet
Each model's score appears here once a scoring round on the held back month has finished. No interim figures and no projections.
status: awaiting out of sample scoring
One field, eight markets,
two of them withdrawn
Each model designed one strategy per market. Every design was locked, then scored exactly once on a sealed six month window. Six of the eight boards are published below. The other two are named, with the reason, and show no figure at all.
The models saw the first block and nothing else. The gap is an embargo: the candles next to the fit are withheld too, so a design cannot ride a trend it was tuned on straight into its own exam. The long block was opened one time, after every design was locked, and what came out of that opening is the whole board below.
Withdrawn
BTCUSD Bitcoin. Every position was priced at a whole bitcoin instead of a hundredth of one, so this board measured a sizing bug rather than a market. Re-run on the corrected engine. On the first re-run the best design came out at +2.4% with no account wiped.
XAGUSD Silver. Every position was twenty times too large, so the two accounts that went to zero were the sizing rule, not the metal. Re-run on the corrected engine, where the smallest lot is 50 ounces rather than 1,000.
The runs stay in the records and this page keeps saying they were made. What comes down is the claim, until the numbers are measured again.
Sized above 1%
On yen the smallest tradeable lot is bigger than 1 percent risk allows on a $10,000 account. The engine flagged it at run time: the smallest lot could put up to 28 percent of the account behind one stop. The dollars on that row are real, but they are not comparable to the 1 percent rows. Every row prints the risk it actually ran.
36 results scored · 13 graded positive · 8 break even · 15 negative · 0 wiped · 0 never traded
positive
Colour is the engine's own verdict grade, not the sign of the money: graded positive, graded break even, graded negative. A thin margin is graded break even even when its dollars are positive, because commission and swap erase it.
Tick length is the size of the result on one shared scale for the whole board, measured from the centre and square rooted so a $60 result stays visible beside a $13,877 one. Sign and order are exact. The longest tick belongs to the row whose minimum lot could not hold 1 percent risk, not to the better design.
6 models scored · 6 markets published · $10,000 each · 1% TARGET RISK · SEALED WINDOW FEB 13 → AUG 14 2026 · spread charged
Four majors ran at a true 1 percent risk, and the best design on every one finished green. Yen is tagged: its lot size floor broke the 1 percent rule, so its dollars are not comparable to the rows above it.
The cell that keeps this board honest. Gold ran at a true 1 percent risk and its best design finished green in dollars, and the engine graded it break even anyway, because that margin does not survive real costs.
150 configurations were searched on training candles through Jan 31, across all eight markets. The sealed window was opened one time, after every design was locked.
Spread charged. Commission and swap not charged: thin margins are graded break even because real costs erase them.
8 models entered, 6 scored. Gemini and Kimi had no API key configured and are recorded as absent, not dropped.
Rows show the largest net P&L per market. The stored records also rank every design by expectancy per trade.
Under 100 closed trades is a small sample. One past window on our candles is a measurement of history, not a forecast.
Run it inside your own product
The engine behind other brands. You own the relationship and the interface; we supply analysis, candle history and outcome resolution.
- The user relationship, and the billing
- The interface, the brand, the domain
- Your own assistant, if you have one
- Candle history, ours, one source
- Geometry computed from those candles
- Outcome resolution, server side
Keys bind to your domains and to the feature set you bought, so a key lifted from your page runs nowhere else. Nothing crosses the line that is not on this list.
curl -X POST https://pipszilla.ai/api/v1/resolve-request \
  -H 'Content-Type: application/json' \
-d '{"text":"draw snd"}'{
"action": "draw",
"flag": "zones",
"candidates": ["zones"],
"confidence": "high"
}Full contract, every detector, engine rules: /api/v1/integration-spec/tools, no authentication.
- White-label embed
- The widget ships under your brand. No Pipszilla marks by default.
- Per-partner features
- Detectors, drawing tools and the history panel are granted one by one. You ship exactly what you sell.
- Public spec
- Tool contracts, detector list and engine rules are published unauthenticated. Read them before contacting us.
Common questions
No. Ask for an entry and the engine declines: nobody knows the next candle, ours included. It draws support, resistance, supply and demand. The trader decides.
Arithmetic on our candle history. Pivots, retracements and levels are computed, never invented by a language model. Same bars, identical lines.
Because that is what it measured. 1.8R average targets thin the win column; expectancy decides, about +0.01R per trade there. Break-even is written as break-even, sample size printed beside it.
A label is not a signal. Double tops exist and traders ask, so they ship as timestamped structure with no targets: follow-through measured 50.3%. The worst two are sealed off entirely.
None. The old model leaderboard was never measured and is gone. What runs is a backtest competition: each model writes a strategy, executed on identical candles with costs charged, scored on an unseen month, published after the round.
Yes. Route messages through your model, call the resolver for the drawing. Your conversation, our geometry.
Each request binds to a publishable key and an anonymous per-browser client id; queries filter on both. Keys lock to registered domains.
It depends on features and volume, so no price list here. The spec is public: read the contract first, then we talk pricing.
Read the spec, then talk to us
Tool contracts, detectors, measurements and engine rules are published without a key. Every claim here can be checked first.